To crack the top 1% income bracket in the United States, you needed to earn at least $898,682 in 2022, according to SmartAsset’s analysis of IRS data. This benchmark, significantly higher than the $758,077 required in 2021, reflects a substantial increase in income concentration at the very top. But income needed to reach the 1% varies widely depending on the state.
The threshold for joining the top 1% saw a significant jump between 2021 and 2022, indicating a more pronounced skew in income distribution. While the figure represents a nationwide average, the actual income required to be considered in the top 1% differs greatly depending on the state, reflecting regional economic disparities. For example, to be in the top 1% in Connecticut you need an income of $952,638 while in West Virginia, $542,513 is enough.
State-by-State Breakdown of the Top 1% Income Threshold
The state with the highest income threshold to enter the top 1% is Connecticut, where you need to earn $952,638. Massachusetts comes in second at $904,526. New Jersey ranks third, requiring $878,267 to be in the top 1%. Rounding out the top five are New York ($871,638) and California ($845,318).
At the other end of the spectrum, West Virginia has the lowest income requirement for the top 1%, with $542,513. Mississippi follows with $565,241, then Kentucky, where an income of $578,588 puts you among the state’s highest earners. Rounding out the bottom five are Louisiana ($582,737) and Arkansas ($591,444).
This variation underscores the vast economic differences between states and the concentration of high earners in specific regions. The disparities are influenced by factors like industry presence, cost of living, and overall economic activity.
Understanding Income Inequality and the Top 1%
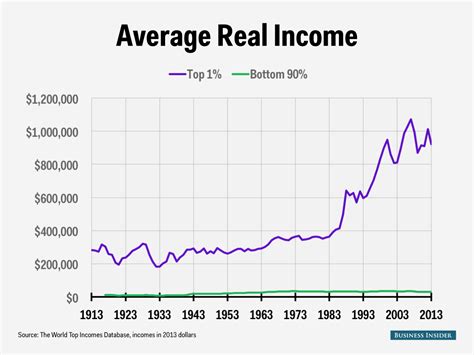
The discussion around the top 1% isn’t merely about statistics; it’s intrinsically linked to broader conversations on income inequality. This metric serves as a tangible indicator of the widening gap between the highest earners and the rest of the population. Analyzing the income required to enter this elite group provides valuable insights into the distribution of wealth and the economic forces driving it.
The significant increase in the top 1% threshold between 2021 and 2022 – an increase of over $140,000 – highlights the fact that income gains are not evenly distributed. This disproportionate growth at the top fuels concerns about fairness and the potential for economic instability.
Factors Influencing the Top 1% Threshold
Several factors contribute to the fluctuation and variation in the top 1% income threshold. These include:
- Economic Growth: Periods of robust economic expansion often lead to increased corporate profits and higher compensation for executives and investors, driving up the income of the top earners.
- Tax Policies: Changes in tax rates and regulations can influence income reporting and investment strategies, impacting the income distribution picture.
- Industry Trends: The dominance of specific industries in certain states can concentrate high-paying jobs and wealth, raising the bar for entry into the top 1%. The tech industry, for example, has had a significant impact on income levels in states like California and Massachusetts.
- Global Economic Forces: International trade, investment flows, and global market trends can all play a role in shaping the income distribution within a country and its constituent states.
The Significance of State-Level Analysis
While national data provides a general overview, state-level analysis offers a more granular and nuanced understanding of income inequality. The disparities between states like Connecticut and West Virginia highlight the importance of considering regional economic contexts when evaluating income distribution.
State-level data can also inform policy decisions aimed at addressing income inequality. By identifying the specific factors driving income concentration in different regions, policymakers can develop targeted interventions to promote greater economic opportunity and fairness.
Beyond Income: Wealth and Assets
It’s crucial to distinguish between income and wealth when discussing the top 1%. While income represents the money earned in a given year, wealth encompasses the total value of assets owned, including real estate, stocks, bonds, and other investments.
The threshold for being in the top 1% of wealth is significantly higher than the income threshold. Data from the Federal Reserve indicates that to be in the top 1% of wealth, a household needs to have over $11 million in net worth. The distribution of wealth is even more concentrated than income, with the top 1% owning a disproportionately large share of the nation’s assets.
Understanding both income and wealth distribution provides a more complete picture of economic inequality. While high income earners may have substantial financial resources, the truly wealthy often derive their income from investments and assets, further compounding their economic advantage.
The Impact of Inflation
Inflation also plays a significant role in understanding income thresholds. As the cost of goods and services rises, incomes need to increase to maintain the same standard of living. The jump in the top 1% income threshold between 2021 and 2022 can be partially attributed to inflationary pressures, which drove up nominal incomes across the board.
However, it’s important to consider whether income gains are keeping pace with inflation. If the incomes of the top 1% are rising faster than the rate of inflation, while the incomes of the rest of the population are lagging behind, this exacerbates income inequality.
The Role of Education and Skills
Education and skills are key determinants of income potential. Individuals with higher levels of education and specialized skills are more likely to command higher salaries and access high-paying jobs.
The increasing demand for skilled workers in industries like technology, finance, and healthcare has contributed to the rise in income inequality. Those with the skills and qualifications to succeed in these sectors have seen their incomes soar, while those without these skills have been left behind.
Policy Implications
The concentration of income at the top has significant policy implications. Policymakers grapple with questions about taxation, social safety nets, and investments in education and infrastructure.
Progressive taxation, where higher earners pay a larger percentage of their income in taxes, is one tool that governments use to address income inequality. The revenues generated from progressive taxes can be used to fund social programs and public services that benefit lower-income individuals and families.
Investments in education and skills training can also help to level the playing field and provide more people with the opportunity to climb the economic ladder. By expanding access to quality education and training programs, governments can help to reduce income inequality and promote greater economic mobility.
The Future of Income Inequality
The future of income inequality is uncertain. Several factors, including technological change, globalization, and policy decisions, will shape the trajectory of income distribution in the years to come.
Automation and artificial intelligence have the potential to further disrupt the labor market, displacing workers in some industries while creating new opportunities in others. The ability of workers to adapt to these changes and acquire new skills will be crucial in determining the impact of technology on income inequality.
Globalization will continue to exert pressure on wages and incomes, as companies seek to lower costs by outsourcing production to countries with lower labor costs. Trade policies and international agreements will play a key role in shaping the impact of globalization on income distribution.
Ultimately, the future of income inequality will depend on the choices that policymakers make. By adopting policies that promote inclusive economic growth, invest in education and skills, and ensure a fair distribution of income, governments can help to create a more equitable and prosperous society for all.
Demographic Trends and the Top 1%
It is important to consider demographic factors when analyzing the top 1%. Race, gender, and age all play a role in shaping income distribution. For example, men are more likely than women to be in the top 1% of income earners, and certain racial and ethnic groups are overrepresented in this group. Understanding these demographic trends can provide insights into the structural factors that contribute to income inequality.
The Role of Entrepreneurship
Entrepreneurship can be a pathway to high income and wealth accumulation. Starting a successful business can provide individuals with the opportunity to earn substantial profits and create jobs for others. However, entrepreneurship is not without its challenges. Access to capital, mentorship, and supportive ecosystems are crucial for aspiring entrepreneurs. Policies that encourage entrepreneurship and provide resources for small businesses can help to promote economic opportunity and reduce income inequality.
The Geographic Concentration of Wealth
Wealth, like income, is geographically concentrated. Certain cities and regions are home to a disproportionate share of the nation’s wealthy individuals and families. Factors such as industry clusters, access to capital markets, and quality of life can attract high-net-worth individuals to specific areas. This geographic concentration of wealth can have both positive and negative effects on local economies. On the one hand, it can lead to increased investment and job creation. On the other hand, it can exacerbate housing costs and create social divisions.
The Impact of Inheritance
Inheritance plays a significant role in wealth accumulation and the perpetuation of inequality across generations. Individuals who inherit substantial assets from their parents or grandparents have a significant head start in life. Inheritance can provide access to capital, education, and other opportunities that are not available to those who do not have family wealth. This can create a cycle of inequality, where wealth is concentrated in the hands of a few families over time. Policies such as estate taxes can help to reduce the impact of inheritance on wealth inequality.
Behavioral Economics and Income Inequality
Behavioral economics provides insights into the psychological factors that can contribute to income inequality. For example, studies have shown that individuals with higher incomes are more likely to exhibit certain cognitive biases, such as overconfidence and risk aversion. These biases can lead to suboptimal financial decisions and exacerbate income inequality. Understanding these behavioral factors can inform the design of policies that promote financial literacy and encourage responsible financial behavior.
The Importance of Social Mobility
Social mobility refers to the ability of individuals to move up or down the economic ladder. In a society with high social mobility, individuals from disadvantaged backgrounds have the opportunity to improve their economic circumstances. In a society with low social mobility, economic status is largely determined by family background. Promoting social mobility is essential for creating a more equitable and just society. Policies that invest in education, affordable housing, and healthcare can help to improve social mobility and reduce income inequality.
The Connection to Political Polarization
There is a growing body of research that suggests a link between income inequality and political polarization. As income inequality increases, people become more divided along economic lines. This can lead to increased political polarization and gridlock, making it more difficult to address the root causes of income inequality. Policies that reduce income inequality can help to bridge the economic divide and foster greater social cohesion.
The Challenge of Measuring Inequality
Measuring income inequality is a complex task. There are various metrics that can be used to assess income distribution, each with its own strengths and weaknesses. The Gini coefficient, for example, is a widely used measure of income inequality that ranges from 0 (perfect equality) to 1 (perfect inequality). However, the Gini coefficient does not capture the full complexity of income distribution. Other metrics, such as the Palma ratio (the ratio of the income of the top 10% to the income of the bottom 40%), can provide additional insights into income inequality.
Long-Term Trends in Income Inequality
Income inequality in the United States has been on the rise for several decades. The gap between the rich and the poor has widened significantly since the 1970s. Several factors have contributed to this trend, including technological change, globalization, and changes in tax policies. Understanding these long-term trends is essential for developing effective policies to address income inequality.
The Future of Work
The future of work is being shaped by technological change, globalization, and demographic shifts. Automation and artificial intelligence are transforming the labor market, creating new opportunities while also displacing workers in some industries. The rise of the gig economy is also changing the nature of work, with more people working as independent contractors or freelancers. These trends have implications for income inequality, as some workers are able to adapt to the changing labor market while others are left behind.
The Role of Government
Government plays a critical role in addressing income inequality. Policies such as progressive taxation, social safety nets, and investments in education and infrastructure can help to reduce income inequality and promote economic opportunity. However, there is ongoing debate about the appropriate role of government in addressing income inequality. Some argue that government should play a more active role in redistributing income and regulating the economy, while others argue that government should focus on creating a favorable environment for economic growth and entrepreneurship.
The Need for a Comprehensive Approach
Addressing income inequality requires a comprehensive approach that addresses the underlying causes of the problem. There is no single solution that will solve income inequality. Instead, a combination of policies and programs is needed to promote inclusive economic growth, invest in education and skills, and ensure a fair distribution of income. This requires collaboration between government, businesses, and civil society organizations.
FAQ: Top 1% Income Threshold
1. What income was required to be in the top 1% in the U.S. in 2022?
According to SmartAsset’s analysis of IRS data, you needed to earn at least $898,682 in 2022 to be in the top 1% nationally.
2. Which state has the highest income threshold to be in the top 1%?
Connecticut has the highest threshold, requiring an income of $952,638 to be in the top 1%.
3. Which state has the lowest income threshold to be in the top 1%?
West Virginia has the lowest threshold, requiring an income of $542,513 to be in the top 1%.
4. How much did the top 1% income threshold increase from 2021 to 2022?
The top 1% income threshold increased from $758,077 in 2021 to $898,682 in 2022, an increase of $140,605.
5. Besides income, what other factors contribute to economic inequality?
Wealth accumulation, access to education and skills, tax policies, industry trends, global economic forces, demographic trends, and the role of inheritance all contribute to economic inequality.
The widening gap between the wealthiest Americans and the rest of the population remains a critical economic and social issue. The data on the top 1% income threshold provides a snapshot of this disparity, highlighting the need for ongoing analysis and policy discussions aimed at fostering a more equitable society.